
TSRA Annual Reports
The Annual Report provides information about the TSRA’s achievements, corporate arrangements and performance each financial year.
Annual Reports
View All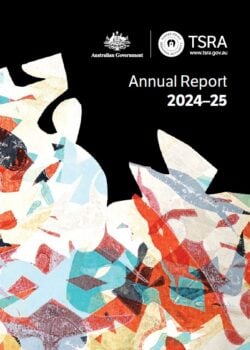
TSRA 2024 – 2025 Annual Report
TSRA 2024-2025 Annual Report is available for download as an accessible PDF and in HTML…
Download
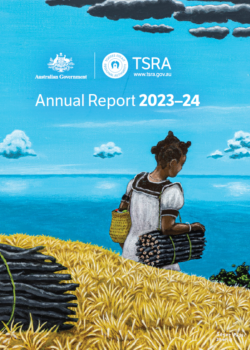
TSRA 2023 – 2024 Annual Report
TSRA’s Annual Report 2023-24 was tabled in Parliament on 6 November 2024. It is available…
Download
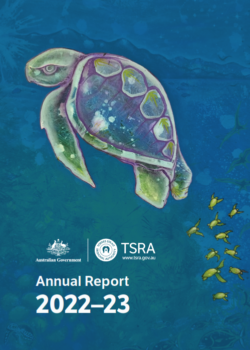
TSRA 2022 – 2023 Annual Report
The complete annual report is available in multiple formats
Download
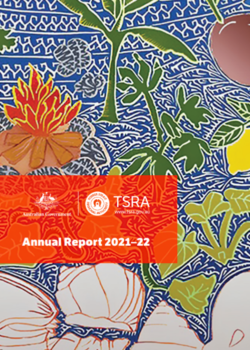
TSRA 2021 – 2022 Annual Report
The complete annual report is available in multiple formats
Download
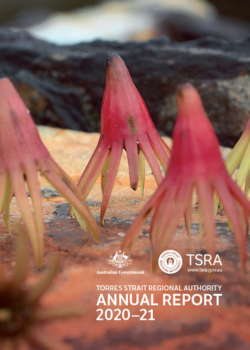
TSRA 2020 – 2021 Annual Report
Download
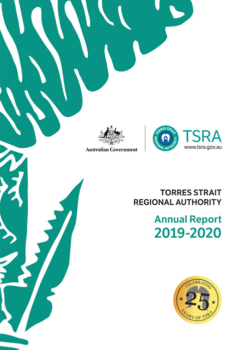
TSRA 2019 – 2020 Annual Report
Download
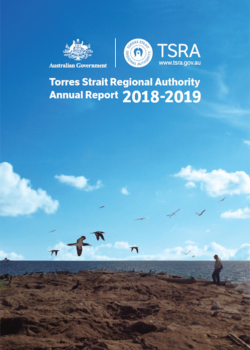
TSRA 2018 – 2019 Annual Report
Download

TSRA 2017 – 2018 Annual Report
Download
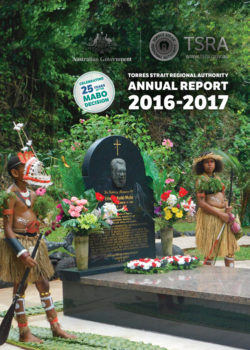
TSRA 2016 – 2017 Annual Report
Download
TSRA 2015 – 2016 Annual Report
Download
TSRA 2014 – 2015 Annual Report
Download
TSRA 2013 – 2014 Annual Report
Download
TSRA 2012 – 2013 Annual Report
Download

TSRA 2011 – 2012 Annual Report
Download
TSRA 2010 – 2011 Annual Report
Download
TSRA 2009 – 2010 Annual Report
Download
TSRA 2008 – 2009 Annual Report
Download
TSRA 2007 – 2008 Annual Report
Download
TSRA 2006 – 2007 Annual Report
Download

TSRA 2005 – 2006 Annual Report
Download
TSRA 2004 – 2005 Annual Report
Download
TSRA 2003 – 2004 Annual Report
Download
TSRA 2002 – 2003 Annual Report
Download
TSRA 2001 – 2002 Annual Report
Download
TSRA 2000 – 2001 Annual Report
Download
TSRA 1999 – 2000 Annual Report
Download
TSRA 1998 – 1999 Annual Report
Download

TSRA 1997 – 1998 Annual Report
Download