Geography and Logistics
The Torres Strait is located in Australia and is part of the north-eastern state, Queensland. The area is approximately 150 kilometres wide at its narrowest point and is situated between the tip of Queensland’s Cape York Peninsula and Papua New Guinea. The region consists of over 270 islands and reefs.
The Torres Strait links the Coral Sea in the east to the Arafura Sea in the west; the two main navigation passages are the Prince of Wales Channel, north of Hammond Island, and the Endeavour Strait, between Cape York and Prince of Wales Island.
The Torres Strait islands have a variety of topographies, ecosystems and formations. Several islands, closest to the Papua New Guinea coastline, are low lying and are regularly inundated by sea water. Many of the western islands are hilly and steep. The central islands are predominantly coral cays and the islands in the east are volcanic.
The TSRA delivers services across the entire Torres Strait region, including 17 inhabited islands and the communities of Bamaga and Seisia in the Northern Peninsula Area of mainland Australia. Due to the area’s remote location, the TSRA relies on air and sea links and limited phone, facsimile and internet communications between communities for the delivery of its services. Most travel within the region is restricted to small watercraft, helicopters and light aircraft. The main gateway to the Torres Strait is Ngarupai Airport located on Horn Island, a 20-minute ferry ride from the Australian Government, Queensland Government and two local government administration hubs located on Thursday Island.
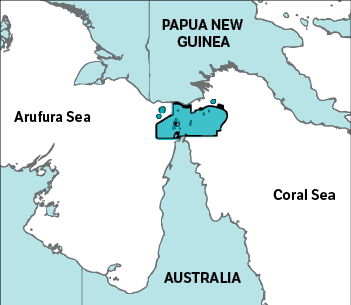
FIGURE 3-1: THE TORRES STRAIT
The bulk of goods and materials required by the region are shipped by container vessel from Cairns and redistributed by barge from transhipment points on Thursday Island and Horn Island.
Culture
The picturesque Torres Strait region is predominantly inhabited by Torres Strait Islanders and Kaurareg Aboriginal people. The Australian Bureau of Statistics reports that as of 30 June 2016 the total population of the region was 9,519, of whom 7,437 (78.13 per cent) were Torres Strait Islander or Aboriginal people.
The Torres Strait’s unique Ailan Kastom (island custom) is a central part of life in the region. Ailan Kastom is kept alive through the arts, rituals and performances, and the preservation of languages and traditional knowledge, which are passed from one generation to the next. Cultural values are strongly intertwined with traditional ancestral ties and respect for the waterways, land and sea and the resources they provide.
History
The Torres Strait is named after Spanish explorer Luis Vaez de Torres, who sailed through the area in 1606. Queensland Government administration of the Torres Strait was established on Thursday Island in 1877, following the arrival of missionaries on Cape York Peninsula. Early settlers were involved in pearling, bêche-de-mer collection, and mining.
Native Title
Torres Strait Islander people first achieved recognition of their land rights in 1992 following the High Court’s landmark Mabo decision which granted the Meriam people Native Title rights over Mer (Murray Island). This was the first time Native Title was recognised under the common law of Australia. It set a precedent for Torres Strait Islander and Aboriginal people throughout Australia to assert their Native Title rights through the Native Title Act 1993 (Cth).
Native Title has been granted for 13 inhabited islands in the Torres Strait region and most of the uninhabited islands. In addition, the Kaurareg Aboriginal people have achieved recognition of their Native Title rights over seven inner islands: Ngarupai (Horn Island), Muralag (Prince of Wales Island), Zuna (Entrance Island), Yeta (Port Lihou Island), Mipa (Turtle Island), Tarilag (Packe Island) and Damaralag. In total, 22 Native Title determinations have been made in the Torres Strait. No new determinations were made in 2017-2018.
Native Title claims are being pursued over three land claims and two sea claims. In 2018, the Native Title Office commissioned research into the remaining unclaimed islands and seas. It is proposed that the remaining claims will be completed in the near future.
Progress Towards Closing the Gap
Closing the Gap is a commitment by the Australian Government and state and territory governments to improve the lives of Torres Strait Islander and Aboriginal Australians and, in particular, to provide a better future for Torres Strait Islander and Aboriginal children.
A national integrated Closing the Gap strategy has been agreed by the Council of Australian Governments (COAG), the peak intergovernmental forum in Australia. COAG brings together the Prime Minister, state premiers, territory chief ministers and the President of the Australian Local Government Association.
Closing the Gap is linked to a wider reform of Commonwealth–state financial relations. COAG’s national agreements and partnerships, in areas such as education, housing and health, are focused on overcoming Indigenous disadvantage.
In 2014-2015, the Australian Government introduced the Indigenous Advancement Strategy, which grouped over 150 Indigenous programmes into five programme streams. These are:
- Jobs, Land and Economy
- Children and Schooling
- Safety and Wellbeing
- Culture and Capability
- Remote Australia Strategies.
Closing the Gap is a commitment by the Australian Government and state and territory governments to improve the lives of Torres Strait Islander and Aboriginal Australians and, in particular, to provide a better future for Torres Strait Islander and Aboriginal children.
The TSRA has aligned its programme outcomes to these streams while continuing to deliver against the COAG targets:
- to close the life expectancy gap within a generation
- to halve the gap in mortality rates for Indigenous children under five within a decade
- to ensure access to early childhood education for all Indigenous four-year-olds in remote communities within five years
- to halve the gap in reading, writing and numeracy achievements for children within a decade
- to halve the gap for Indigenous students in Year 12 (or equivalent) attainment rates by 2020
- to halve the gap in employment outcomes between Indigenous and non-Indigenous Australians within a decade.
COAG Building Blocks
The TSRA’s programme structure is based on the six COAG Building Blocks for closing the gap in disadvantage between Indigenous and non-Indigenous Australians. The building blocks are also used as the framework for the TSRA’s Integrated Service Delivery (ISD) project.
In 2008-2009, the TSRA completed community consultations as part of the development of the Torres Strait and Northern Peninsula Area Regional Plan 2009-2029. The TSRA’s contribution towards the targeted outcomes of the Torres Strait and Northern Peninsula Area Regional Plan 2009-2029 are noted in the Torres Strait Development Plan 2014-2018, which details the TSRA’s programmes and how they contribute to regional outcomes, the Australian Government’s Indigenous Advancement Strategy and the United Nations Articles on the Rights of Indigenous Peoples.
In 2009-2010, the ISD project identified 1,613 gaps in service delivery across 20 communities. Detail of the service gaps is contained in the Torres Strait Regional Plan ISD Community Booklets. A booklet for each community can be accessed via the TSRA website (www.tsra.gov.au).
In 2017-2018, the ISD initiative was limited to operational activities and re-establishing the ISD governance framework. Since the local government, TSRA, Queensland Government and Australian Government elections were held in 2016, there have been changes of personnel in the governance framework that have had an effect on the progress of ISD in the region.
The TSRA will conduct a review of the ISD project in 2018-2019, with a focus on re-establishing the governance framework and strengthening the project at the operational level. The TSRA will also continue to lobby relevant Queensland Government and Australian Government ministers to secure commitment for the ISD project.
Regional Statistics
The latest data available at the time of writing this report was from the Australian Bureau of Statistics (ABS). The TSRA has used this data to benchmark the progress of the TSRA’s programmes against Closing the Gap targets. The data used throughout this section was taken from the ABS QuickStats website and was current at 30 June 2018.
The figures are for the Torres Strait and the two communities in the Northern Peninsula Area (Bamaga and Seisia) which are included in the TSRA’s area of responsibility.
Population
The comparison of population changes across the Torres Strait and Northern Peninsula Area (Bamaga and Seisia) is shown in tables 3-1 to 3-4.
TABLE 3-1: TOTAL POPULATION OF THE TORRES STRAIT INCLUDING BAMAGA AND SEISIA
| Torres Shire Local Government Area |
Torres Strait Island Regional Council Local Government Area | Bamaga | Seisia | Region (Total) |
|||||
|---|---|---|---|---|---|---|---|---|---|
| 2011 | 2016 | 2011 | 2016 | 2011 | 2016 | 2011 | 2016 | 2011 | 2016 |
| 3,256 | 3,610 | 4,248 | 4,514 | 1,046 | 1,164 | 203 | 260 | 8,753 | 9,548 |
TABLE 3-2: TORRES STRAIT ISLANDER AND ABORIGINAL POPULATION OF THE TORRES STRAIT INCLUDING BAMAGA AND SEISIA
| Torres Shire Local Government Area |
Torres Strait Island Regional Council Local Government Area | Bamaga | Seisia | Region (Total) |
|||||
|---|---|---|---|---|---|---|---|---|---|
| 2011 | 2016 | 2011 | 2016 | 2011 | 2016 | 2011 | 2016 | 2011 | 2016 |
| 2,063 | 2,482 | 3,856 | 4,144 | 845 | 957 | 135 | 201 | 6,899 | 7,784 |
In 2016, the Torres Strait Islander and Aboriginal population of the Torres Shire Local Government Area represented 68.6 per cent of the total population. For the Torres Strait Island Regional Council Local Government Area, the Torres Strait Islander and Aboriginal population represented 91.8 per cent of the total population. This shows a slight increase in the proportion of Torres Strait Islander and Aboriginal people in those two areas compared to 2011. The Torres Strait Islander and Aboriginal population represented 74.4 per cent of the total population in Seisia and 82.4 per cent in Bamaga.
TABLE 3-3: GENDER BALANCE OF THE TORRES STRAIT INCLUDING BAMAGA AND SEISIA
| Torres Shire Local Government Area |
Torres Strait Island Regional Council Local Government Area | Bamaga | Seisia | Region (Average) |
||||||
|---|---|---|---|---|---|---|---|---|---|---|
| 2011 | 2016 | 2011 | 2016 | 2011 | 2016 | 2011 | 2016 | 2011 | 2016 | |
| Male | 49.8% | 49.5% | 51.3% | 50.8% | 49.4% | 47.9% | 49.1% | 51.1% | 49.5% | 50.1% |
| Female | 50.2% | 50.5% | 48.7% | 49.2% | 50.6% | 52.1% | 50.9% | 48.9% | 50.5% | 49.9% |
The gender balance average compared to 2011 shows an increase of males by 1.2 per cent.
TABLE 3-4: AVERAGE AGE OF POPULATION OF THE TORRES STRAIT INCLUDING BAMAGA AND SEISIA
| Torres Shire Local Government Area |
Torres Strait Island Regional Council Local Government Area | Bamaga | Seisia | Region (Average) |
|||||
|---|---|---|---|---|---|---|---|---|---|
| 2011 | 2016 | 2011 | 2016 | 2011 | 2016 | 2011 | 2016 | 2011 | 2016 |
| 28 | 28 | 23 | 24 | 23 | 24 | 31 | 25 | 23 | 25 |
Apart from Seisia, where there has been a decrease in the average age of the population, the population age across the region remained more or less consistent between 2011 and 2016. The age profile in Seisia is believed to be skewed by the number of non-resident visitors in the community at the time of the 2011 Census.
Employment
In Table 3-5, the employment data for the Torres Strait relates only to Torres Strait Islander and Aboriginal people, while the figures for Bamaga and Seisia include Indigenous and non-Indigenous employees.
TABLE 3-5: EMPLOYMENT IN THE TORRES STRAIT INCLUDING BAMAGA AND SEISIA
| Torres Strait | Bamaga | Seisia | Region (Total) |
|||||
|---|---|---|---|---|---|---|---|---|
| Employment type | 2011 | 2016 | 2011 | 2016 | 2011 | 2016 | 2011 | 2016 |
| Full time | 1,039 | 915 | 277 | 311 | 76 | 65 | 1,392 | 1,291 |
| Part time | 837 | 547 | 84 | 93 | 17 | 12 | 938 | 652 |
| Away from work | 226 | 159 | 14 | 20 | 6 | 3 | 246 | 182 |
| Unemployed | 173 | 287 | 29 | 42 | 0 | 15 | 202 | 344 |
| Total labour | 2,275 | 1,908 | 404 | 466 | 99 | 95 | 2,778 | 2,469 |
Education
The number of people undertaking some form of education in 2016-2017 was 3,641. The education categories are shown in Table 3-6.
TABLE 3-6: EDUCATION IN THE TORRES STRAIT INCLUDING BAMAGA AND SEISIA
| Torres Shire Local Government Area | Torres Strait Island Regional Council Local Government Area | Bamaga | Seisia | Region (Total) |
||||||
|---|---|---|---|---|---|---|---|---|---|---|
| Education level | 2011 | 2016 | 2011 | 2016 | 2011 | 2016 | 2011 | 2016 | 2011 | 2016 |
| Pre-school | 68 | 85 | 91 | 89 | 14 | 25 | 0 | 3 | 173 | 202 |
| Primary | 333 | 378 | 780 | 783 | 175 | 198 | 22 | 29 | 1,310 | 1,388 |
| Secondary | 253 | 318 | 176 | 221 | 89 | 92 | 8 | 20 | 526 | 651 |
| Technical or further | 43 | 59 | 97 | 72 | 24 | 19 | 3 | 5 | 167 | 155 |
| University | 71 | 74 | 25 | 20 | 10 | 11 | 3 | 4 | 109 | 109 |
| Other | 11 | 8 | 47 | 17 | 7 | 11 | 0 | 6 | 65 | 42 |
| Not stated | 504 | 594 | 247 | 412 | 54 | 60 | 17 | 28 | 822 | 1,094 |
| Total | 1,283 | 1,516 | 1,463 | 1,614 | 373 | 416 | 53 | 95 | 3,172 | 3,641 |
The Tagai State College average school attendance in 2016, across years 1 to 12, was 89 per cent. This figure is slightly below the whole-of-Queensland attendance rate average of 90 per cent.
Income
The 2016 Census data indicates an improvement in the average household incomes of Torres Strait Islander and Aboriginal people. This is reflected in Table 3-7.
TABLE 3-7: MEDIAN WEALTH IN THE TORRES STRAIT INCLUDING BAMAGA AND SEISIA ($/WEEK)
| Torres Shire Local Government Area |
Torres Strait Island Regional Council Local Government Area | Bamaga | Seisia | Region (Average) |
||||||
|---|---|---|---|---|---|---|---|---|---|---|
| Income type | 2011 | 2016 | 2011 | 2016 | 2011 | 2016 | 2011 | 2016 | 2011 | 2016 |
| Personal | 682 | 740 | 314 | 373 | 577 | 568 | 506 | 592 | 411 | 484 |
| Household | 1,579 | 1,837 | 849 | 929 | 1,117 | 1,402 | 785 | 1,261 | 971 | 1,357 |
The Queensland averages for personal and household income were $660 and $1,402 per week. The Australian averages were $662 and $1,438.
Housing Tenure
The 2016 Census reported that there were 2,267 dwellings; the tenure arrangements are shown in Table 3-8.
TABLE 3-8: TENURE OF PRIVATE DWELLINGS IN THE TORRES STRAIT INCLUDING BAMAGA AND SEISIA
| Torres Shire Local Government Area |
Torres Strait Island Regional Council Local Government Area | Bamaga | Seisia | Region (Total) |
||||||
|---|---|---|---|---|---|---|---|---|---|---|
| Tenure type | 2011 | 2016 | 2011 | 2016 | 2011 | 2016 | 2011 | 2016 | 2011 | 2016 |
| Owned | 65 | 76 | 49 | 31 | 0 | 3 | 5 | 5 | 119 | 115 |
| Mortgaged | 48 | 35 | 0 | 0 | 0 | 0 | 4 | 0 | 52 | 35 |
| Rented | 632 | 646 | 856 | 907 | 245 | 273 | 53 | 59 | 1,786 | 1,885 |
| Other | 17 | 6 | 9 | 18 | 3 | 0 | 0 | 0 | 29 | 24 |
| Not stated | 53 | 147 | 28 | 33 | 8 | 18 | 0 | 10 | 89 | 208 |
| Total | 815 | 910 | 942 | 989 | 256 | 294 | 62 | 74 | 2,075 | 2,267 |
The figures in Table 3-8 indicate a decrease in the number of houses owned in the region between 2011 and 2016. There was a significant increase in the number of properties being rented. Complex land tenure arrangements in the region and a lack of freehold land and long-tenure leasehold land remain challenges to increasing home ownership.
Health
A synthesis of data obtained at 30 June 2018 from the ABS Australian Aboriginal and Torres Strait Islander Health Survey 2012-2013 (updated) shows:
- Torres Strait Islander and Aboriginal people were more than three times as likely as non-Indigenous people to have diabetes.
- Torres Strait Islander and Aboriginal people were twice as likely as non-Indigenous people to have signs of chronic kidney disease.
- Obesity rates for Torres Strait Islander and Aboriginal females and males were higher than the comparable rates for non-Indigenous people in every age group.
- Torres Strait Islander and Aboriginal people’s rates of heart disease were significantly higher than the comparable rates for non-Indigenous people in all age groups from 15 to 54 years.
The mortality rates for Torres Strait Islander and Aboriginal males in the 35-44 age group were over four times higher than rates for non-Indigenous males. The mortality rates for Torres Strait Islander and Aboriginal females in the 25-29 age group and the 35-39 age group were five times higher than rates for non-Indigenous females.