-
-
Annual Reports
- Annual Report 2022 - 2023
- Annual Report 2021 - 2022
- Annual Report 2020 - 2021
- Annual Report 2019 - 2020
- Annual Report 2018 - 2019
- Annual Report 2017 - 2018
- Annual Report 2016 - 2017
- Annual Report 2015 - 2016
- Annual Report 2014 - 2015
- Annual Report 2013 - 2014
- Annual Report 2012 - 2013
- Annual Report 2011 - 2012
- Annual Report 2010 - 2011
- Accountability and Reporting
- TSRA News & Media
- Torres Strait Development Plan
-
Annual Reports
OUTCOMES AND PLANNED PERFORMANCE
This section provides details of performance against the key performance indicators contained in the TSRA Portfolio Budget Statements 2016-2017.
This is followed by additional reporting on other activities undertaken by the TSRA's programme areas:
- Economic Development
- Fisheries
- Culture, Art and Heritage
- Native Title
- Environmental Management
- Governance and Leadership
- Healthy Communities
- Safe Communities.
Each programme report provides the following information:
- a statement of the regional goal, programme outcomes and projects and initiatives set out in the Torres Strait Development Plan 2014-2018
- a summary of expenditure
- a summary of performance.
The Torres Strait Development Plan 2014-2018 was developed by the TSRA as required by section 142D of the Aboriginal and Torres Strait Islander Act 2005 (Cth). The plan outlines eight TSRA programmes, listing the desired outcomes and benefits to be delivered. The Torres Strait Development Plan 2014-2018 is published on the TSRA website (www.tsra.gov.au).
The Torres Strait Development Plan 2014-2018 is derived directly from the Torres Strait and Northern Peninsula Area Regional Plan 2009-2029. The regional plan was developed by the TSRA, the Torres Shire Council, the Torres Strait Island Regional Council and the Northern Peninsula Area Regional Council, in consultation with Torres Strait communities. The regional plan captures community challenges, priorities and aspirations. A key element of the regional plan is its focus on integrated development planning and Integrated Service Delivery. This process aims to coordinate the effective delivery of a range of government services to local communities while ensuring that duplication and service gaps are minimised.
INTEGRATED PLANNING FRAMEWORK
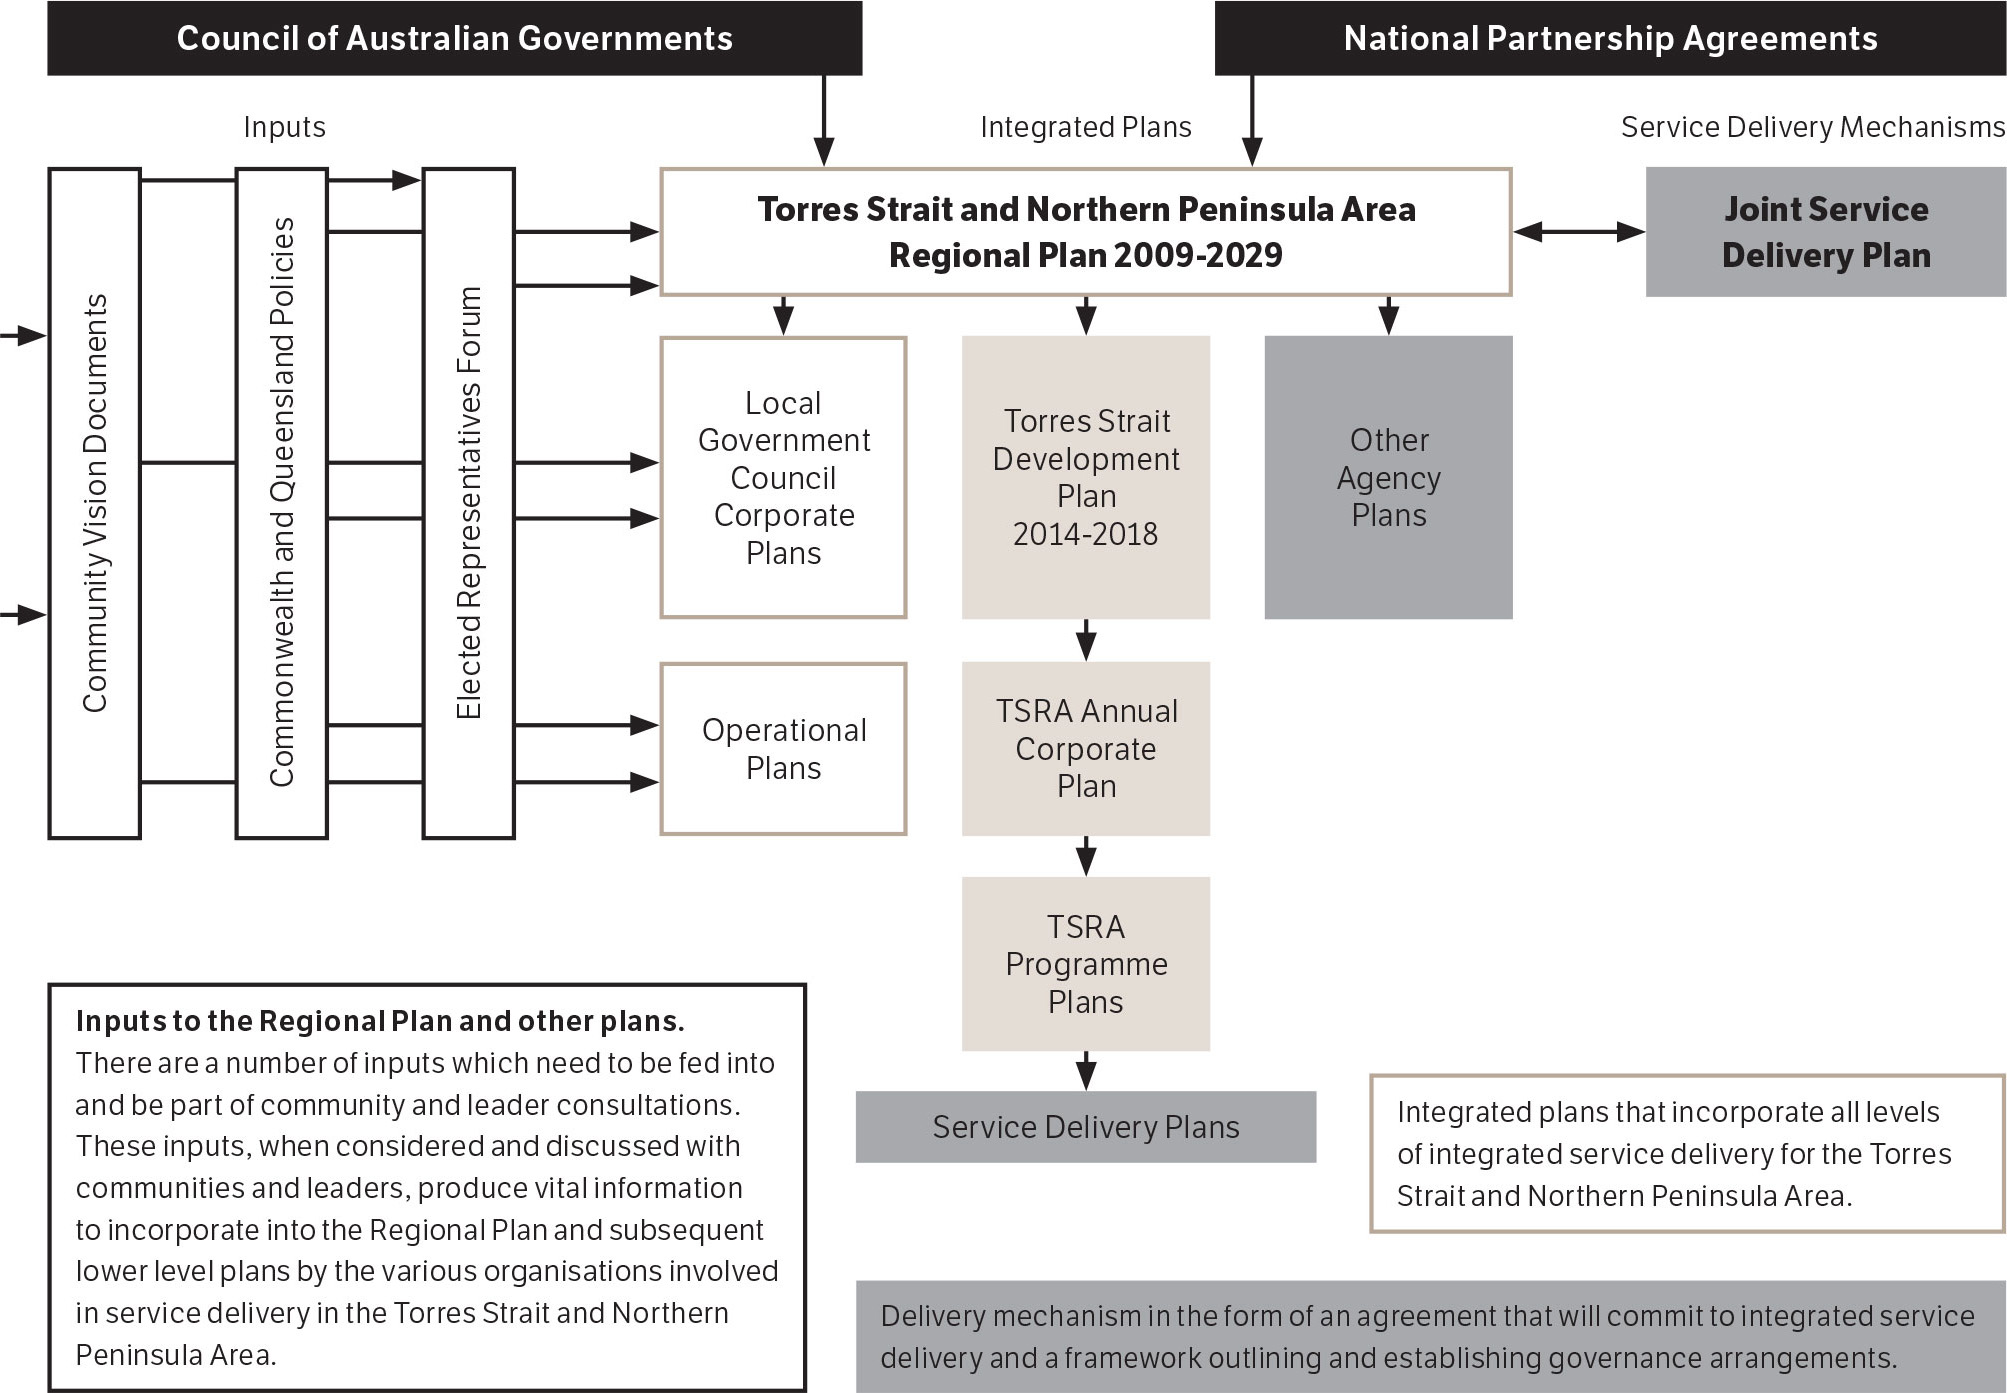
FIGURE 2-1 TORRES STRAIT REGIONAL AUTHORITY INTEGRATED PLANNING FRAMEWORK
SUMMARY OF FINANCIAL PERFORMANCE
Appropriation programme expenditure
A summary of the TSRA's financial performance for each programme area for 2016-2017 is provided in Table 2-1.
Further information about programme income and expenditure, including notes on variances, is detailed in the financial statements, which are in Section 5 of this report.
| TABLE 2-1 APPROPRIATION PROGRAMME EXPENDITURE, BUDGET COMPARED TO ACTUAL, 2016-2017 | |||
| Programme | Budget $000 | Actual $000 | Variance $000 |
|---|---|---|---|
| Economic Development | 5,385 | 4,975 | (410) |
| Fisheries | 2,481 | 2,706 | 225 |
| Culture, Art and Heritage | 4,441 | 4,540 | 99 |
| Native Title | 4,114 | 4,365 | 251 |
| Environmental Management | 4,926 | 4,531 | (395) |
| Governance and Leadership | 4,909 | 4,777 | (132) |
| Healthy Communities | 6,218 | 6,249 | 31 |
| Safe Communities | 4,519 | 4,822 | 303 |
| Total | 36,993 | 36,965 | (28) |
| Note: The total variance represents 0.08 per cent of budget. | |||
External funding programme expenditure
Five programmes received external funding, as detailed in Table 2-2.
| TABLE 2-2 EXTERNAL FUNDING PROGRAMME EXPENDITURE, BUDGET COMPARED TO ACTUAL, 2016-2017 | |||
| Programme | Budget $000 | Actual $000 | Variance $000 |
|---|---|---|---|
| Culture, Art and Heritage | 475 | 472 | 3 |
| Environmental Management | 10,636 | 10,531 | 105 |
| Fisheries | 7,000 | 3,200 | 3,800 |
| Healthy Communities | 7,500 | 7,500 | 0 |
| Native Title Office | 500 | 293 | 207 |
| Total | 26,111 | 21,996 | 4,115 |